Caffeine Comparison Tool
Use this caffeine comparison chart to compare common stimulant sources side by side across caffeine, sugar, calories, price, and crash risk.
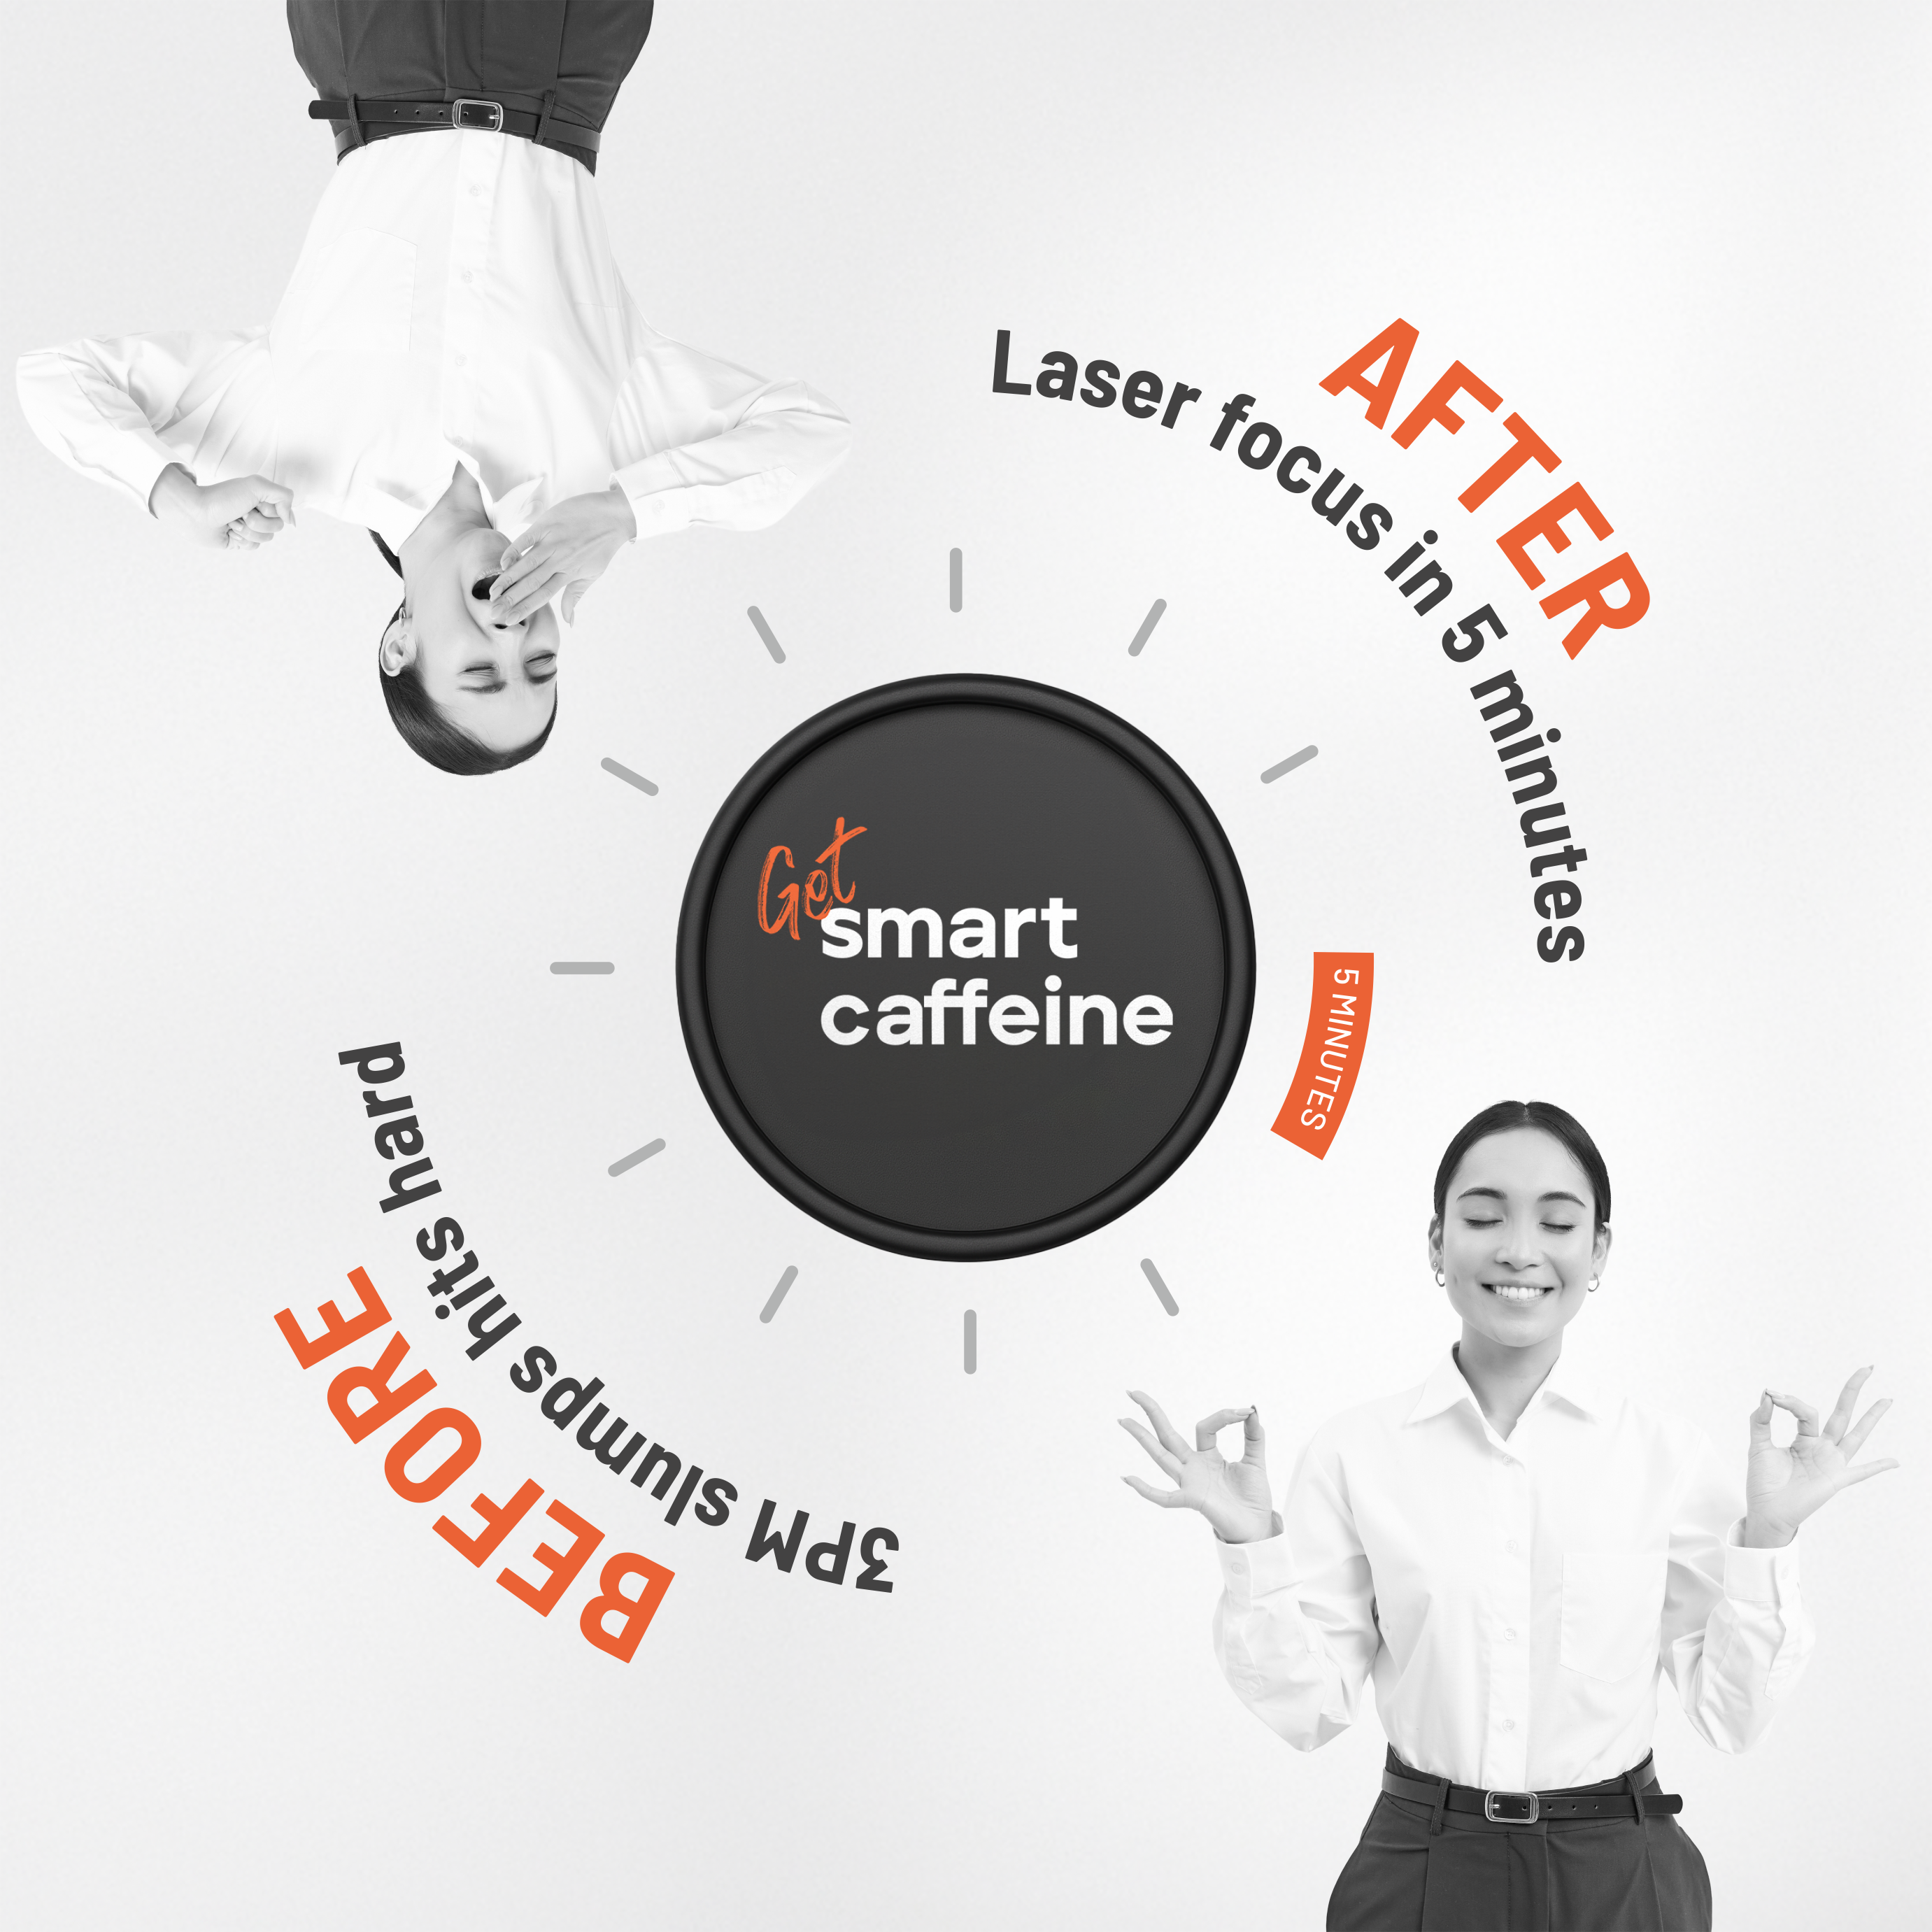
It is useful when you want to know not just which option hits harder, but which one gives you better value and cleaner energy.
How To Use This Tool
- Select between two and four items from the comparison list.
- Review the table and visual bars for caffeine amount, sugar load, and cost.
- Use the winner badges to spot which choice is best for the metric you care about most.
| Source | Caffeine | Sugar | Calories | Price | Serving | Crash risk |
|---|---|---|---|---|---|---|
| Smart Caffeine | 80mg | 0g Lowest sugar | 7.82 | ₹20 Best value | 1 sachet (2g) | Low Lowest crash risk |
| Filter Coffee | 95mg | 0g | 2 | ₹30 | 1 cup (240ml) | Medium |
| Red Bull | 80mg | 27g | 110 | ₹125 | 1 can (250ml) | High |
Summary verdict
Smart Caffeine stands out when you want a controlled 80mg dose, minimal sugar, and lower crash risk than energy drinks or high-dose stimulant options.
FAQ
Why compare sugar and calories instead of only caffeine?
Because the stimulant experience is not only about caffeine. Sugar load and calories can change the crash profile and the way the energy feels.
Why is Smart Caffeine highlighted?
It is the branded reference product for the site, and it offers a clean fixed-dose benchmark against more variable drinks.
What does crash risk mean here?
It is a practical shorthand for how likely a source is to produce a steep drop in energy based on dose, sugar, and delivery format.